Facebook and Google feel like a dream come true for UA advertisers.
Two platforms to place ads, manage budgets and gauge effectiveness? It sounds like a great option. And it can be.
Old hands and newcomers alike have been quick to rely on these self-attributing networks. And while they can offer reliable results, they’re often outperformed by regular-attributing networks.
Every savvy UA marketer should know their RANs from their SANs, so let’s take a look at the pros and cons of both…
SANs & RANs
Self-attributing networks (SANs) are suppliers that calculate their attribution without input from third-party tracking providers. These networks include Facebook, Google and Twitter.
SANs have plenty of scale and good quality inventory, but transparency is limited with no third-party tracking: and that makes it harder to optimise campaigns.
The other option is regular-attributing networks (RANs). These suppliers let third-party tracking providers work out the attribution. They include both ad networks like Unity and Tapjoy, and DSPs like Liftoff and Smadex.
RANs are much more transparent than SANs, and so easier to optimise. But there’s also a higher risk of invalid inventory and fraudulent installs, so you should always back up your use with verification tools like Machine.
With the right strategy, going beyond SANs can increase scale and performance, and give you a better return on ad spend (ROAS).
RANs in action
Let’s take a 16-week journey. It’s a journey that a gaming client of ours took (who we’ll call Emma). Emma thought she may be over-investing in SANs and wanted to investigate RANs.
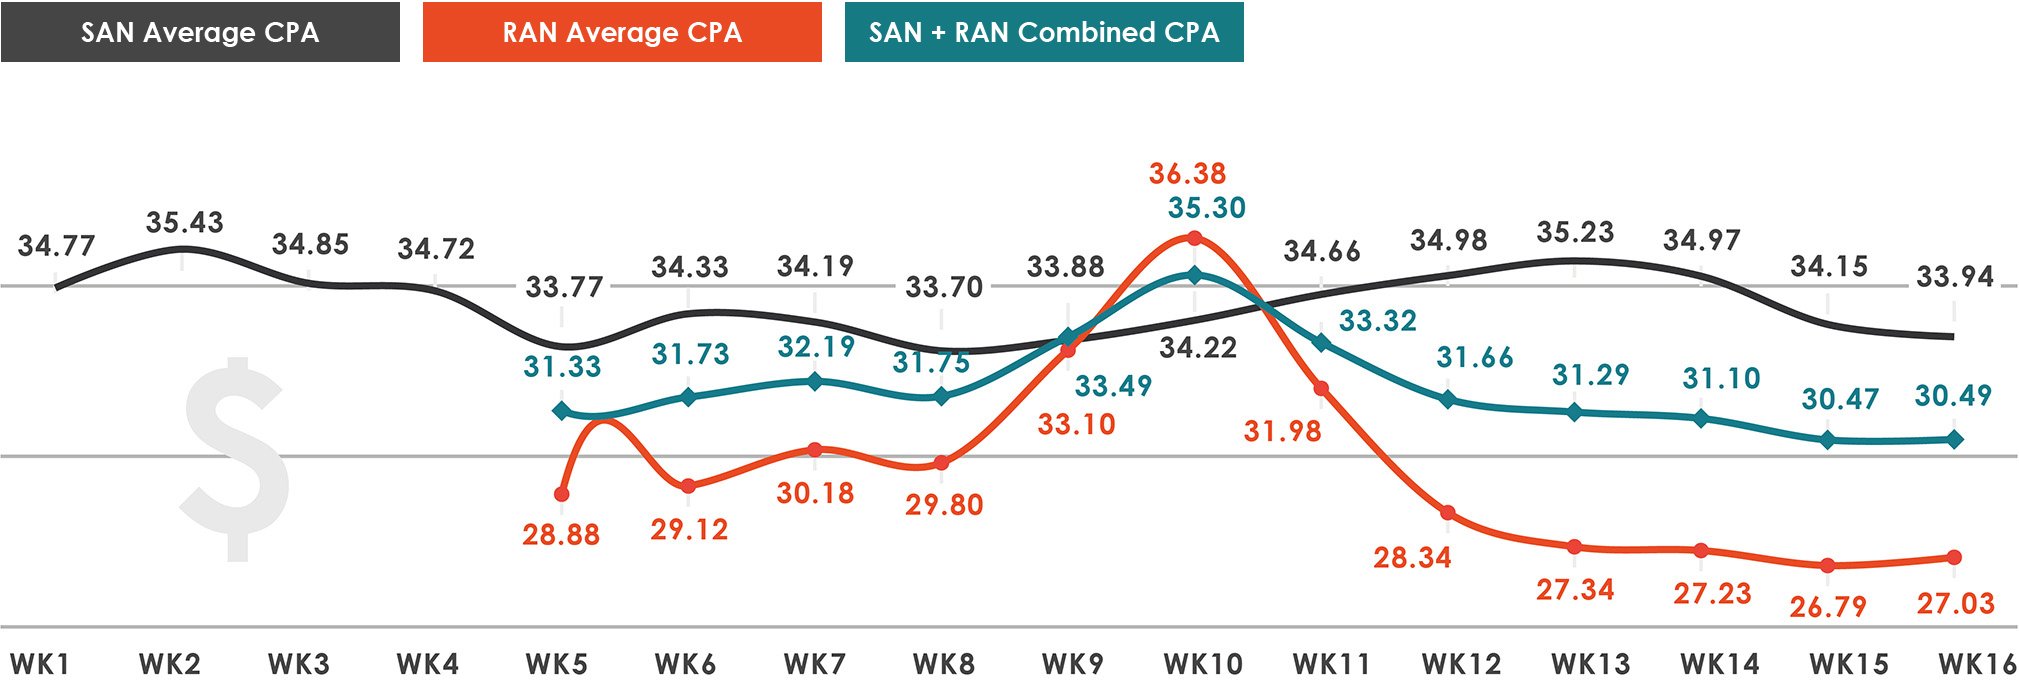
The first four weeks of each chart shows the SANs baseline numbers. These were the expected returns on ad spend that Emma had come to expect: a baseline CPA of $34.94 using SANs.

How CPA improved over the 16 weeks.
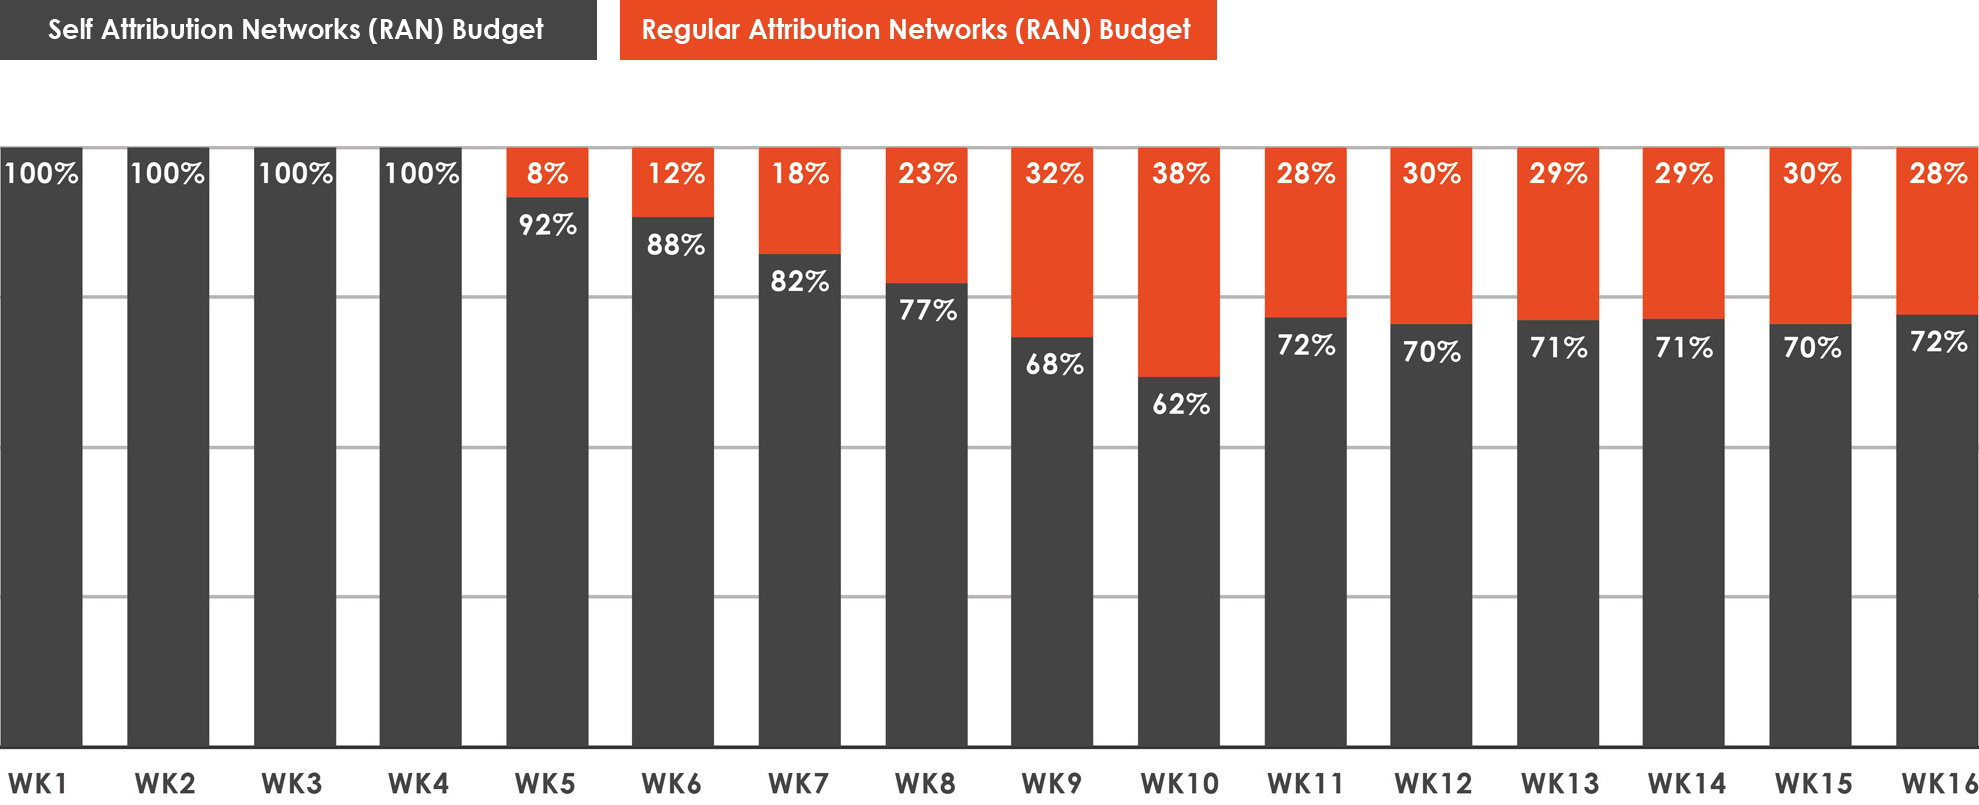
From week 5, Emma started using RANs. She used Machine’s verification tools and erred on the side of caution by allocating 8% of the budget to one ad network and one DSP. The impact was immediate. With a baseline CPA on the SANs of $34.94, after just one week of adding RANs the overall campaign CPA dropped 10% to $31.33.
At first, we thought this was a bit of luck: a new supplier bump is quite common. But as Emma started to increase the RAN budget through weeks 6, 7 and 8, the average CPA stayed at a steady $32.29 – which is more than just luck.
One of the objectives of the test was to find the optimal budget balance between SANs and RANs. In week 9, with two ad networks and two DSPs, Emma increased the RAN allocation to 32% of her budget. This was when we saw the first sign of a negative impact on the campaign results. Emma didn’t want to make a knee-jerk reaction, so she kept increasing the RAN budget again in week 10 – and the negative trend continued.

The experimentation with budget distribution over 16 weeks.
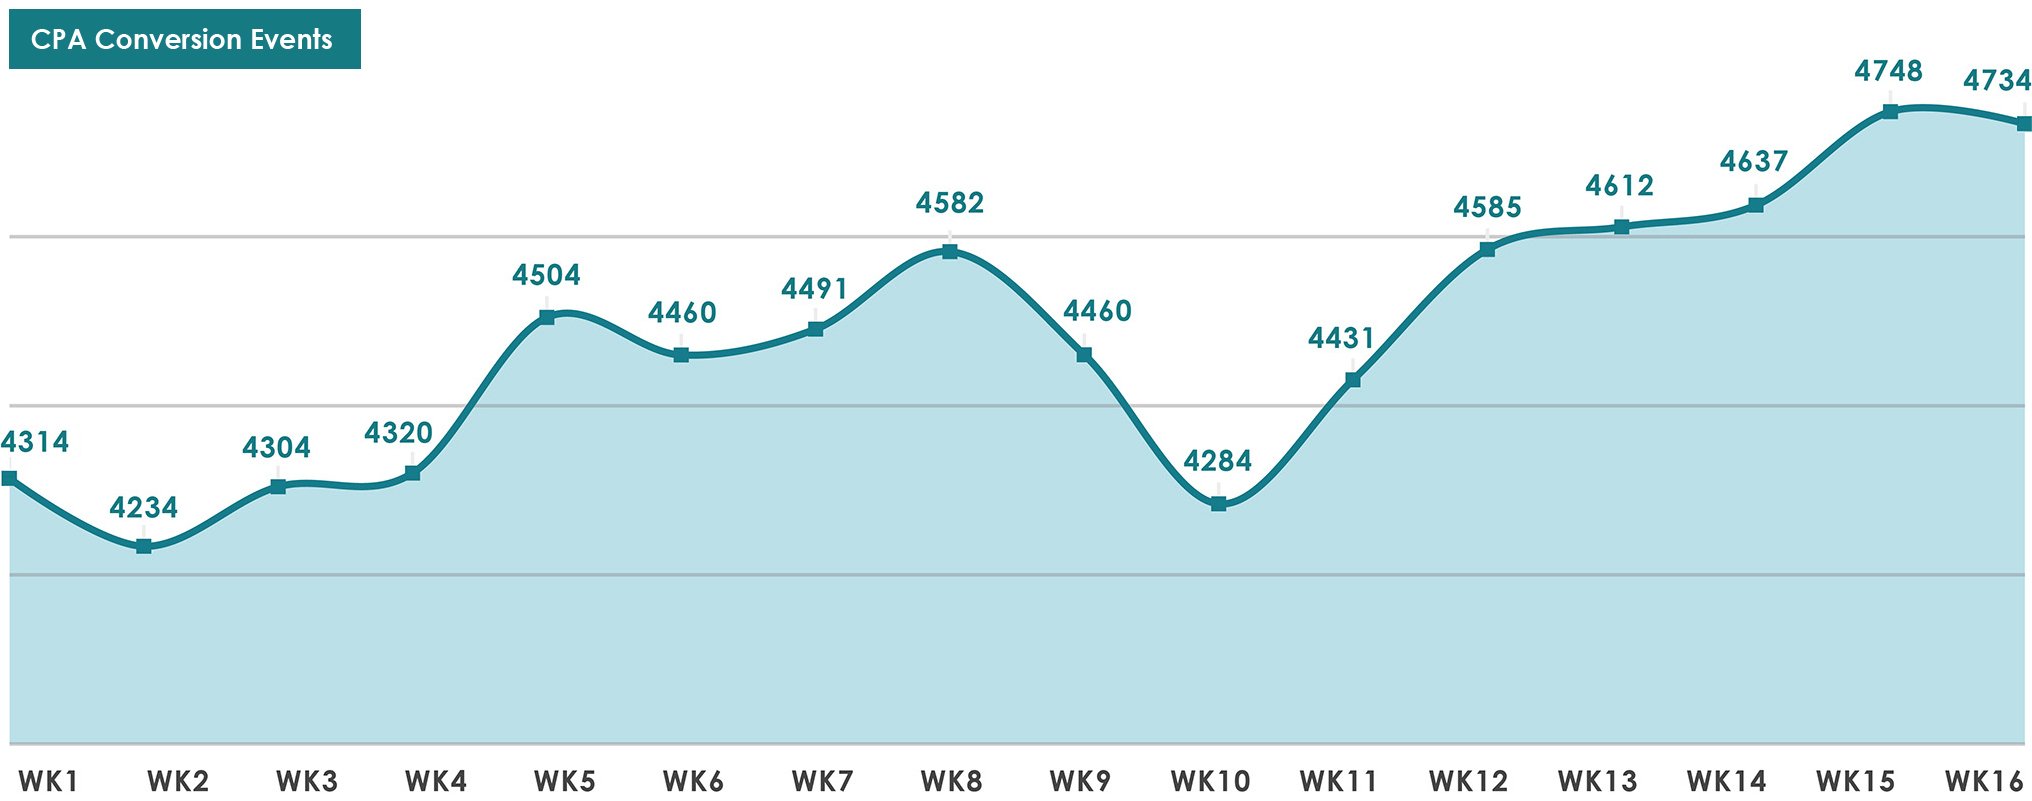
In week 11, Emma dropped the RANs back to 28%. With increased transparency over SANs and so more optimisation opportunities, the RAN’s performance improved through weeks 12 to 16. The average CPA stayed below $31, and the average weekly conversion events reaching a new high of 4663 – it’s still there today.

How CPA conversion events improved over the 16 weeks.
Add RANs to your mix today
This isn’t a one-off: it’s a business case we’ve proved time and time again with other clients. If you’re over-dependent on the SANs there’s a real chance you’ve reached a point of diminishing returns, and they could well be over-claiming installs. Try adding RANs to the mix – but make sure you’re acting on verified data.
Like Emma, I’m sure you’ll discover how to grow beyond Facebook and Google.
An abbreviated PDF business case is available to share with your colleagues:
At Machine, we can help you detect app install fraud, and make sure your UA budget is converting into real users' budget.


